Table of Contents:
Introduction:
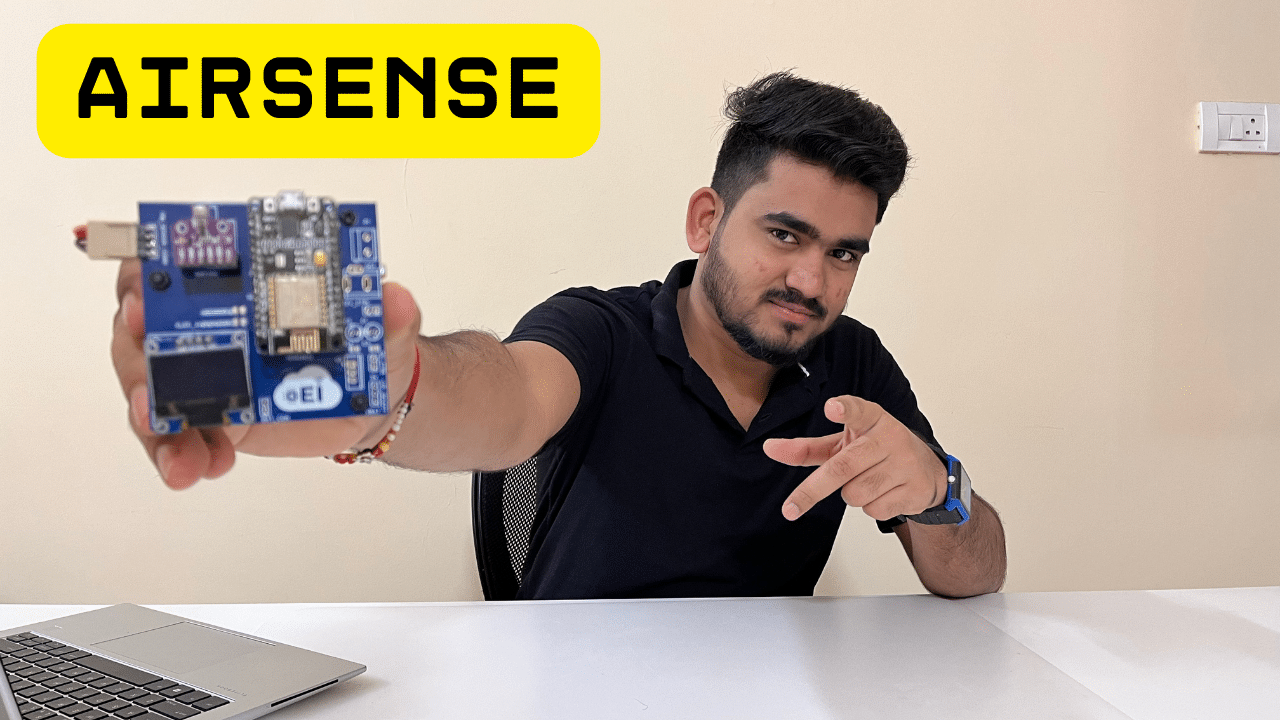
In this blog post, we’re diving into the exciting world of DIY electronics with a detailed look at the creation of “AirSense” an IoT-Based Air Quality Monitoring System. This project combines hardware and software elements to create a device capable of monitoring various environmental parameters in real-time and uploading the data to the cloud for analysis and visualization.
Previous is all about , how I made this Indoor Air Quality Monitoring system, which measures and displays PM2.5 and PM10, temperature and humidity, gas resistance and estimated CO2, pressure, and altitude.
The Air Quality System is working perfectly and providing accurate information. However, it is assembled on a temporary breadboard and occupies more space. So, I have decided to make a PCB where it will be assembled permanently, within a smaller footprint.
Additionally, the project is offline-based, and I am unable to track the data. There is no history of data available, all we can see is the instantaneous data. To mitigate this, I wanted to provide IoT capabilities to the device and push all the data to the cloud. This way, we can have a history of the data.
PCBway:
The PCBs I’m gonna use in this video are ordered from PCBway.com, PCBWAY is one of the best PCB manufacturers in the current industry.
PCBway is offering services like PCB prototype, SMD Stencil, PCB assembly, Flexible PCBs & Advanced PCBs.
At PCBway.com we can get 10 pieces of 2 layered PCBs at just $5 with 24 hours build time.
The Best part of PCBway is the Instant quote feature, just enter the PCB size, choose the quantity, layers, and thickness. That’s it, we will get the instant quote. place an order by clicking on saving to cart.

This tutorial is also available in the video format, due to the lengh we have divided the video into 2 parts, you can watch the below videos or continue reading this article.
Video Tutorial: AirSense Part1
Video Tutorial: AirSense Part2
Required components:
1. ESP8266 Module (Buy from Amazon)
2. BME680 Sensor (Buy from Amazon)
3. SDS011 Sensor (Buy from Amazon)
4. OLED DIsplay, (Buy from Amazon)
5. connecting wires (Buy from Amazon)
6. Breadboard, (Buy from Amazon)
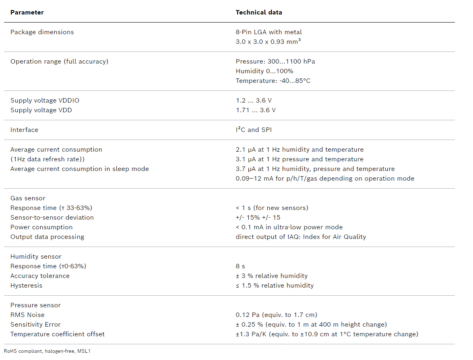
Overview: BME680 Sensor
This little device is like an environmental Swiss Army knife. It measures temperature, helping you gauge the warmth around you. It senses pressure, which is handy for predicting weather or estimating altitude. It keeps tabs on humidity, an essential metric for both comfort and health. And, it even measures gas resistance, giving you insights into air quality, including CO2 levels. Understanding these measurements is key to creating a safer and more comfortable environment.
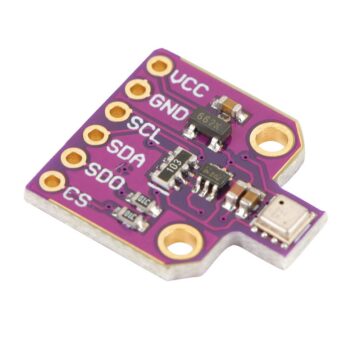
Kindly refer to the below image for the sensor’s specifications.
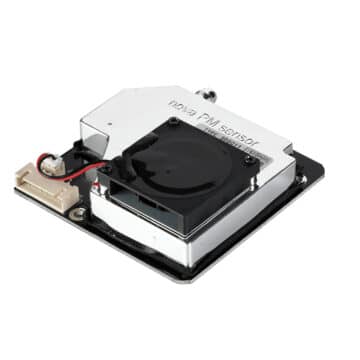
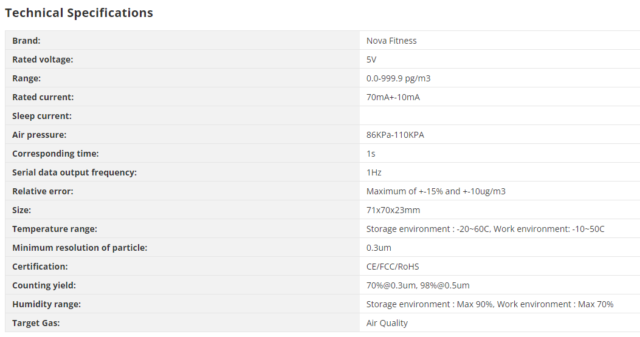
Overview: SDS011 Sensor
The SDS011 stands out as a renowned air quality sensor, designed to measure particulate matter in the air. Its functionality is rooted in the principle of laser scattering.
The Air will enter from Particle Inflow nozzle and then comes out from the Particle outflow nozzle. there will be a Laser Diode and also a photodiode inside the sensor. when particles in the air scatter the laser light, this deflection is then detected by a photodetector. Notably, this sensor is adept at detecting particles of sizes 2.5µm and 10µm, often referred to as PM2.5 and PM10.
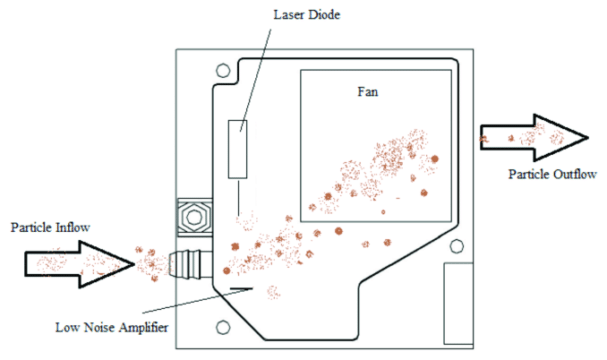
It’s worth noting that these readings are pivotal indicators of environmental pollution. Elevated PM values pose significant health risks, especially concerning the respiratory system.
Kindly refer to the below image for the sensor’s specifications.
Circuit Diagram: DIY Air Quality Monitor
This illustration showcases how we have connected the BME680 Sensor, SDS011 Sensor, and OLED Display to the ESP8266,in the previous Indoor Air Quality Monitoring system project.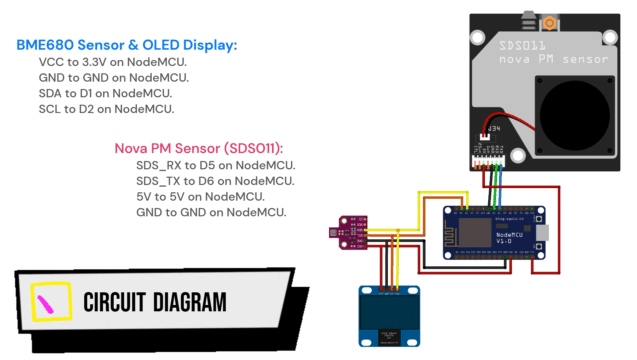
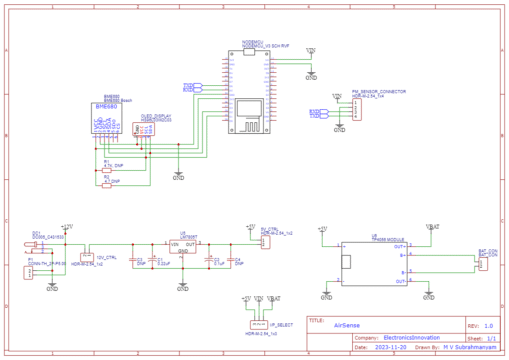
Schematic Diagram: AirSense
The project begins with the design of a schematic diagram, which outlines the components and their connections. The key components include an ESP8266 module, OLED display, BME680 sensor, and PM sensor, all interconnected to form a comprehensive air quality monitoring system. The diagram serves as a blueprint for the subsequent PCB design.
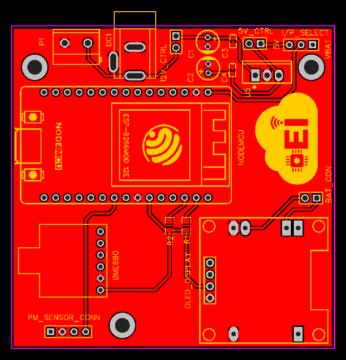
PCB Designing:
Using the schematic diagram as a reference, the PCB (Printed Circuit Board) design phase begins. This involves laying out the components on a physical board in a way that optimizes space and ensures efficient connectivity. The design incorporates provisions for power supply options, including a voltage regulator and a Li-ion battery, as well as connectors for interfacing with external sensors.
Top Layer:
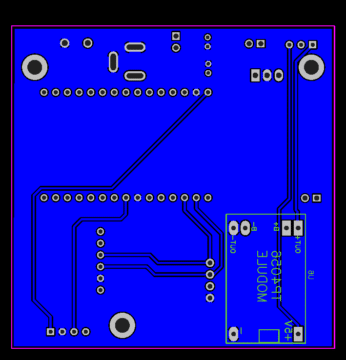
Bottom Layer:
PCB Order:
Once the PCB design is finalized, the next step is to order the fabrication of the boards. This involves generating Gerber files from the design software and submitting them to a PCB manufacturer.
The video tutorial (Airsense Part1) details the process of ordering PCBs from PCBWay.com, a reputable online PCB manufacturing service, including selecting specifications, uploading files, and tracking the progress of the order.
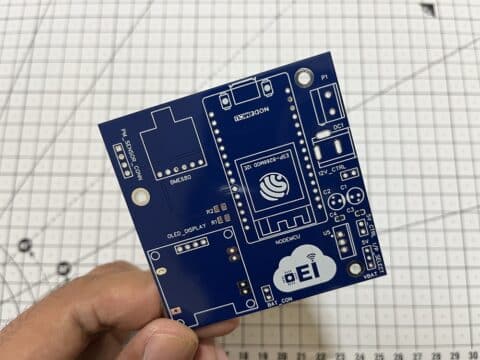
Unboxing PCB:
As you can see, the packaging is secure and well-protected, ensuring that our PCB arrives in pristine condition.
Taking the first look at this bare PCB, I was immediately struck by its professional appearance and tactile quality.
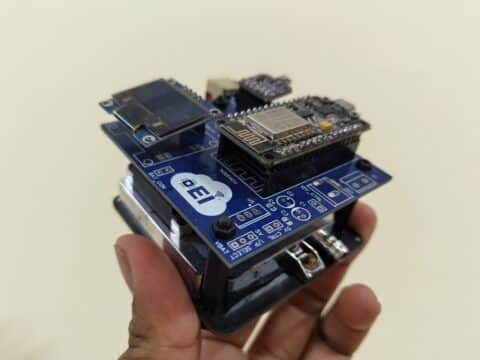
PCB Assembly:
The assembly process is a crucial step in bringing the project to life. began with soldering components onto the PCB, including jumper pins, main controller, sensors, and display. Then PM sensor attached beneath the PCB to optimize space.
Source code: AirSense
Here’s the code for the Airsense project! It’s essentially the same as the one we discussed in the indoor air quality monitoring system. I’ve taken that code and added IoT capabilities to it.
#include <Wire.h>
#include <Adafruit_GFX.h>
#include <Adafruit_SSD1306.h>
#include <Adafruit_Sensor.h>
#include <Adafruit_BME680.h>
#include <SoftwareSerial.h>

#include "UbidotsESPMQTT.h"

#define SCREEN_WIDTH 128
#define SCREEN_HEIGHT 64
Adafruit_SSD1306 display(SCREEN_WIDTH, SCREEN_HEIGHT, &Wire, -1);
Adafruit_BME680 bme;

#define SDS_RX D5
#define SDS_TX D6
SoftwareSerial sds(SDS_RX, SDS_TX);

float R0;  // Initial resistance of the gas sensor in fresh air

#define TOKEN "Enter Ubidots TOKEN" // Your Ubidots TOKEN
#define WIFINAME "SSID" //Your SSID
#define WIFIPASS "Password" // Your Wifi Pass

Ubidots client(TOKEN);

float getEstimatedCO2(float gasResistance) {
    float m = -200;
    float c = 600;
    float estimatedCO2 = m * (R0 / gasResistance) + c;
    return estimatedCO2;
}

void callback(char* topic, byte* payload, unsigned int length) {
  Serial.print("Message arrived [");
  Serial.print(topic);
  Serial.print("] ");
  for (int i=0;i<length;i++) {
    Serial.print((char)payload[i]);
  }
  Serial.println();
}


void setup() {
  // put your setup code here, to run once:
      Serial.begin(115200);
    while (!Serial);

    if (!display.begin(SSD1306_SWITCHCAPVCC, 0x3C)) {
        Serial.println(F("SSD1306 allocation failed"));
        for (;;);
    }
    display.clearDisplay();

    sds.begin(9600);

    if (!bme.begin()) {
        Serial.println(F("Could not find a valid BME680 sensor, check wiring!"));
        while (1);
    }

    bme.setTemperatureOversampling(BME680_OS_8X);
    bme.setHumidityOversampling(BME680_OS_2X);
    bme.setPressureOversampling(BME680_OS_4X);
    bme.setIIRFilterSize(BME680_FILTER_SIZE_3);
    bme.setGasHeater(320, 150);

    delay(10000);
    if (!bme.performReading()) {
        Serial.println(F("Failed to perform initial BME680 reading."));
        while (1);
    }
    R0 = bme.gas_resistance;

  client.setDebug(true); // Pass a true or false bool value to activate debug messages
  client.wifiConnection(WIFINAME, WIFIPASS);
  client.begin(callback);
  }

void loop() {
  // put your main code here, to run repeatedly:
  if(!client.connected()){
      client.reconnect();
      }


    static int page = 1;

    switch (page) {
        case 1: {
            // Display SDS011 data
            while (sds.available() && sds.read() != 0xAA) {}
            byte buffer[10];
            buffer[0] = 0xAA;
            if (sds.available() >= 9) {
                sds.readBytes(&buffer[1], 9);
                if (buffer[9] == 0xAB) {
                    int pm25int = (buffer[3] << 8) | buffer[2];
                    int pm10int = (buffer[5] << 8) | buffer[4];
                    float pm2_5 = pm25int / 10.0;
                    float pm10 = pm10int / 10.0;

                    client.add("PM2.5", pm2_5);
                    client.add("PM10", pm10);
                    client.ubidotsPublish("AirSense");
                    client.loop();

                    display.clearDisplay();
                    display.setTextSize(1);
                    display.setTextColor(WHITE);
                    display.setCursor(0, 0);
                    display.print("PM2.5: ");
                    display.setTextSize(2);
                    display.setCursor(0, 12);
                    display.print(pm2_5, 2);
                    display.setTextSize(1);
                    display.setCursor(80, 17);
                    display.print(" µg/m3");

                    display.setCursor(0, 32);
                    display.print("PM10: ");
                    display.setTextSize(2);
                    display.setCursor(0, 44);
                    display.print(pm10, 2);
                    display.setTextSize(1);
                    display.setCursor(80, 49);
                    display.print(" µg/m3");
                    display.display();

                }
            }
            delay(2000);
            break;
        }
        case 2: {
            if (!bme.performReading()) {
                Serial.println(F("Failed to perform BME680 reading."));
                return;
            }
            display.clearDisplay();
            display.setTextSize(1);
            display.setTextColor(WHITE);
            display.setCursor(0, 0);
            display.print("Temp: ");
            display.setTextSize(2);
            display.setCursor(0, 12);
            display.print(bme.temperature, 1);
            client.add("Temp", bme.temperature);
            display.setTextSize(1);
            display.setCursor(90, 17);
            display.print(" deg C");
            display.setTextSize(1);
            display.setCursor(0, 32);
            display.print("Hum: ");
            display.setTextSize(2);
            display.setCursor(0, 44);
            display.print(bme.humidity, 1);
            client.add("Hum", bme.humidity);
            display.setTextSize(1);
            display.setCursor(90, 49);
            display.print(" %");
            display.display();

            client.ubidotsPublish("AirSense");
            client.loop();
            delay(2000);
            break;
        }
        case 3: {
            float estimatedCO2 = getEstimatedCO2(bme.gas_resistance);
            display.clearDisplay();
            display.setTextSize(1);
            display.setTextColor(WHITE);
            display.setCursor(0, 0);
            display.print("Gas: ");
            display.setTextSize(2);
            display.setCursor(0, 12);
            display.print(bme.gas_resistance / 1000.0, 2);
            client.add("Gas", bme.gas_resistance / 1000.0);
            display.setTextSize(1);
            display.setCursor(90, 17);
            display.print(" KOhms");
            display.setCursor(0, 32);
            display.print("eCO2: ");
            display.setTextSize(2);
            display.setCursor(0, 44);
            display.print(estimatedCO2);
            client.add("eCO2", estimatedCO2);
            display.setTextSize(1);
            display.setCursor(95, 49);
            display.print(" ppm");
            display.display();

            client.ubidotsPublish("AirSense");
            client.loop();
            delay(2000);
            break;
        }
        case 4: {
            float seaLevelPressure = 1013.25; // default sea level pressure in hPa
            float altitude = bme.readAltitude(seaLevelPressure);
            display.clearDisplay();
            display.setTextSize(1);
            display.setTextColor(WHITE);
            display.setCursor(0, 0);
            display.print("Pressure: ");
            display.setTextSize(2);
            display.setCursor(0, 12);
            display.print(bme.pressure / 100.0F, 2); // Convert Pascal to hPa
            client.add("Pressure", bme.pressure / 100.0F);
            display.setTextSize(1);
            display.setCursor(90, 17);
            display.print(" hPa");
            display.setCursor(0, 32);
            display.print("Altitude: ");
            display.setTextSize(2);
            display.setCursor(0, 44);
            display.print(altitude, 1);
            client.add("Altitude", altitude);
            display.setTextSize(1);
            display.setCursor(90, 49);
            display.print(" M");
            display.display();

            client.ubidotsPublish("AirSense");
            client.loop();
            delay(2000);
            break;
        }
    }

    page++;
    if (page > 4) page = 1;
}
Code Detailed Explanation: AirSense
Libraries and Constants
- This section includes necessary libraries for OLED display, BME680 sensor, SDS011 sensor, SoftwareSerial, and Ubidots MQTT client.
- It also defines the screen width and height constants for the OLED display.
#include <Wire.h>
#include <Adafruit_GFX.h>
#include <Adafruit_SSD1306.h>
#include <Adafruit_Sensor.h>
#include <Adafruit_BME680.h>
#include <SoftwareSerial.h>
#include "UbidotsESPMQTT.h"

#define SCREEN_WIDTH 128
#define SCREEN_HEIGHT 64
OLED Display and BME680 Sensor Initialization
Objects for the OLED display and BME680 sensor are created.
Adafruit_SSD1306 display(SCREEN_WIDTH, SCREEN_HEIGHT, &Wire, -1);
Adafruit_BME680 bme;
SDS011 Sensor Configuration
Defines pin connections for the SDS011 sensor using SoftwareSerial.
#define SDS_RX D5
#define SDS_TX D6
SoftwareSerial sds(SDS_RX, SDS_TX);
Global Variables
- Declares a global variable
R0for the initial resistance of the gas sensor. - Defines constants for the Ubidots token, WiFi SSID, and password.
- Creates an instance of the Ubidots MQTT client.
You have to get the ubidot’s token from Ubidot’s website, in the above tutorial video I have clearly explained the process of getting this, if you face any difficultied follow that.
float R0;  // Initial resistance of the gas sensor in fresh air
#define TOKEN "Enter Ubidots TOKEN" // Your Ubidots TOKEN
#define WIFINAME "SSID" //Your SSID
#define WIFIPASS "Password" // Your Wifi Pass
Ubidots client(TOKEN);
Functions
getEstimatedCO2()calculates the estimated CO2 level based on gas resistance.callback()is the MQTT callback function to handle incoming messages from the MQTT broker.
float getEstimatedCO2(float gasResistance) {
    float m = -200;
    float c = 600;
    float estimatedCO2 = m * (R0 / gasResistance) + c;
    return estimatedCO2;
}

void callback(char* topic, byte* payload, unsigned int length) {
    // MQTT callback function to handle incoming messages
}
Setup
- Initializes serial communication and waits until a connection is established.
- Initializes the OLED display, SDS011 sensor, and BME680 sensor.
- Sets up parameters for the BME680 sensor.
- Performs an initial reading from the BME680 sensor to determine the initial gas resistance (R0).
- Sets up the Ubidots MQTT client with WiFi connection and MQTT callback function.
void setup() {
    Serial.begin(115200);
    while (!Serial);

    // OLED display initialization
    if (!display.begin(SSD1306_SWITCHCAPVCC, 0x3C)) {
        Serial.println(F("SSD1306 allocation failed"));
        for (;;);
    }
    display.clearDisplay();

    // SDS011 sensor initialization
    sds.begin(9600);

    // BME680 sensor initialization
    if (!bme.begin()) {
        Serial.println(F("Could not find a valid BME680 sensor, check wiring!"));
        while (1);
    }
    // Setting oversampling and filtering parameters
    bme.setTemperatureOversampling(BME680_OS_8X);
    bme.setHumidityOversampling(BME680_OS_2X);
    bme.setPressureOversampling(BME680_OS_4X);
    bme.setIIRFilterSize(BME680_FILTER_SIZE_3);
    bme.setGasHeater(320, 150);

    // Delay for sensor stabilization
    delay(10000);
    if (!bme.performReading()) {
        Serial.println(F("Failed to perform initial BME680 reading."));
        while (1);
    }
    R0 = bme.gas_resistance;

    // Ubidots MQTT client setup
    client.setDebug(true);
    client.wifiConnection(WIFINAME, WIFIPASS);
    client.begin(callback);
}
Loop
- Checks if the MQTT client is connected and reconnects if necessary.
- Uses a static variable
pageto keep track of which sensor data to display on the OLED. - Switches between different display pages based on the value of
page. - For each page:
- Reads data from sensors.
- Adds the data to the Ubidots client.
- Displays the data on the OLED display.
- Delays for 2 seconds before moving to the next page.
void loop() {
    // Check MQTT connection and reconnect if necessary
    if (!client.connected()) {
        client.reconnect();
    }

    // Static variable to keep track of display pages
    static int page = 1;

    // Switch between different display pages
    switch (page) {
        case 1: {
            // Display SDS011 data
            // Read data from SDS011 sensor
            // Add data to Ubidots client
            // Display data on OLED display
            delay(2000);
            break;
        }
        case 2: {
            // Read data from BME680 sensor
            // Add data to Ubidots client
            // Display data on OLED display
            delay(2000);
            break;
        }
        case 3: {
            // Calculate estimated CO2 level
            // Add data to Ubidots client
            // Display data on OLED display
            delay(2000);
            break;
        }
        case 4: {
            // Read altitude from BME680 sensor
            // Add data to Ubidots client
            // Display data on OLED display
            delay(2000);
            break;
        }
    }

    // Increment page counter and reset if necessary
    page++;
    if (page > 4) page = 1;
}
Uploading code to AirSense:
Connect the ESP8266 module with a laptop. Check the uploading configuration Board: NodeMCU 1.0(ESP12E module), Uploading speed, and select the right port. If everything okay, upload the code.
After successful uploading open the serial monitor, and then restart the ESP8266 module.
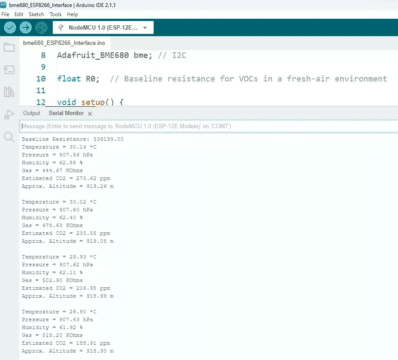
Output: AirSense
After successful uploading open the serial monitor. On the Serial monitor, we can see ESP32 successfully connected to the programmed wifi and allocated with an IP address. Then initiated MQTT connection with Ubidots cloud and connected to it. Then it started publishing the data, such as PM2.5 and PM10, temperature, humidity, gas resistance, estimated CO2, pressure, and altitude. Then it’s pushing the updated PM values, and the loop continues.
Ubidots:
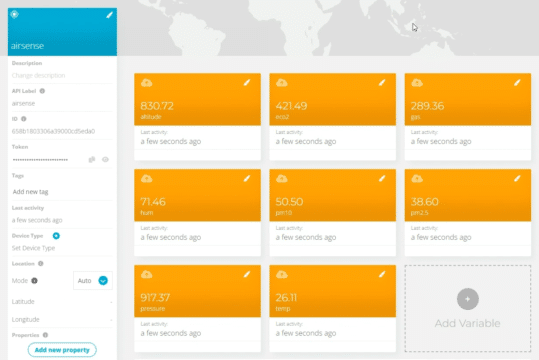
Now, Go to Ubidots and reload it. If you click on the device, you can see the variables and their data.
The best part of the Ubidots is if it receives data from any Module it will automatically create those variables and start storing data for us. here you can see the same variables are created automatically.
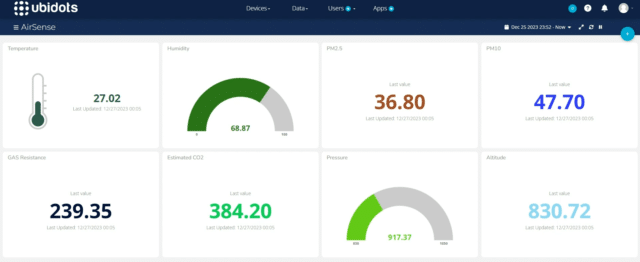
Ubidots Data Visualization:
Currently, we are receiving and storing it on the ubidots, let’s visualize the same data. for that Click on Data and then choose Dashboard.
In the dashboards section, we already have a demo dashboard demonstrating Ubidots’ visualization capabilities.
Let’s create our own dashboard. First, we need to delete the demo dashboard.
Then, let’s proceed to create a dashboard. My dashboard name will be Airsense, and I will keep the rest of the settings default and click on save.
The new dashboard has been created, and we need to start visualizing the variables using widgets.
Click here to add a new widget, select the widget type—I’m selecting the thermometer to visualize the temperature. Similarly, we can use other widgets based on the variable data type.
Then, click on add variable, select the device, and then select the variable. Finally, click on save.
A new thermometer widget has been successfully added to the dashboard, where the data will be updated on the go.
Similarly, let’s add widgets for other variables.
So, that’s all! We have successfully added the widgets to visualize the temperature, humidity, PM2.5, PM10, gas resistance, estimated CO2, pressure, and altitude.
Visualizing this data in real-time provides invaluable insights into environmental conditions, enabling us to monitor air quality levels with precision. Moreover, the live data updates empower us to make informed decisions promptly, whether it’s adjusting ventilation systems, implementing air purification measures, or simply staying informed about the surrounding air quality dynamics.
And that’s a wrap! We’ve unboxed and assembled our Airsense project, and connected to Ubidots, we’re now monitoring environmental data in real-time. Stay tuned to electronics innovation for more projects. Wish you and happy tinkering!
bubyeee…
This tutorial is also available in the video format, due to the lengh we have divided the video into 2 parts.
Great
The AirSense IoT-based air quality monitor is an impressive innovation, offering real-time insights into environmental conditions. By integrating IoT technology, it not only enhances data accuracy but also enables remote monitoring, which is crucial for proactive environmental management. This system could be a game-changer in urban areas where pollution levels fluctuate significantly.
One key takeaway is the importance of scalable deployment for such devices. Ensuring that AirSense is accessible and affordable for a wide range of users, including both residential and industrial sectors, could maximize its impact on public health.
For future iterations, it might be beneficial to explore the integration of AI-powered predictive analytics. This could help in forecasting potential air quality issues and enabling preemptive actions, thus further contributing to healthier living environments.
I love your article and welcome you to visit my website https://gekunflex.com/